Trips & Vehicles
Start, run and end trips, report on a month or a date range, and manage your vehicles
How trips work
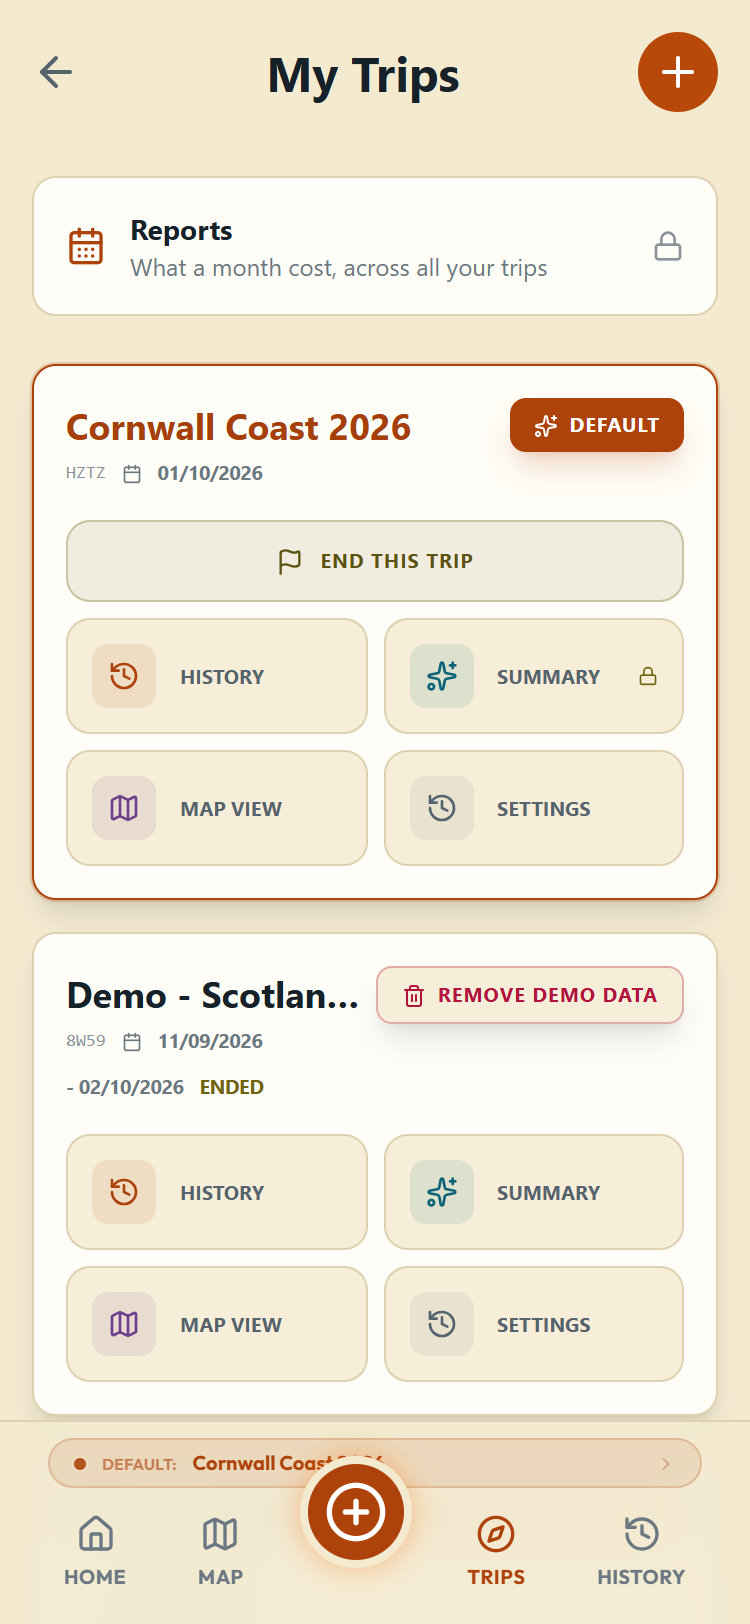
Every entry you log belongs to a trip. One trip at a time is yourcurrent trip: the one new entries are filed against unless you say otherwise. My Trips (from Home, or the Trips tab in the bottom bar) lists them all, with a Current Trip picker at the top. The card of whichever trip is current is marked Current; tap Make current on any other trip to move it, or choose it in the picker. The two sample trips are the exception: a sample cannot be made your current trip, so its card offers Remove samples where the others offer Make current (the Sample trips card above the list has the same button), and samples are left out of the picker.
Having no current trip at all is a normal state, not something broken. You are left with none after you end a trip, and you can choose "No current trip" in the picker yourself. While there is none, the app asks which trip you mean the first time you log something rather than choosing for you.
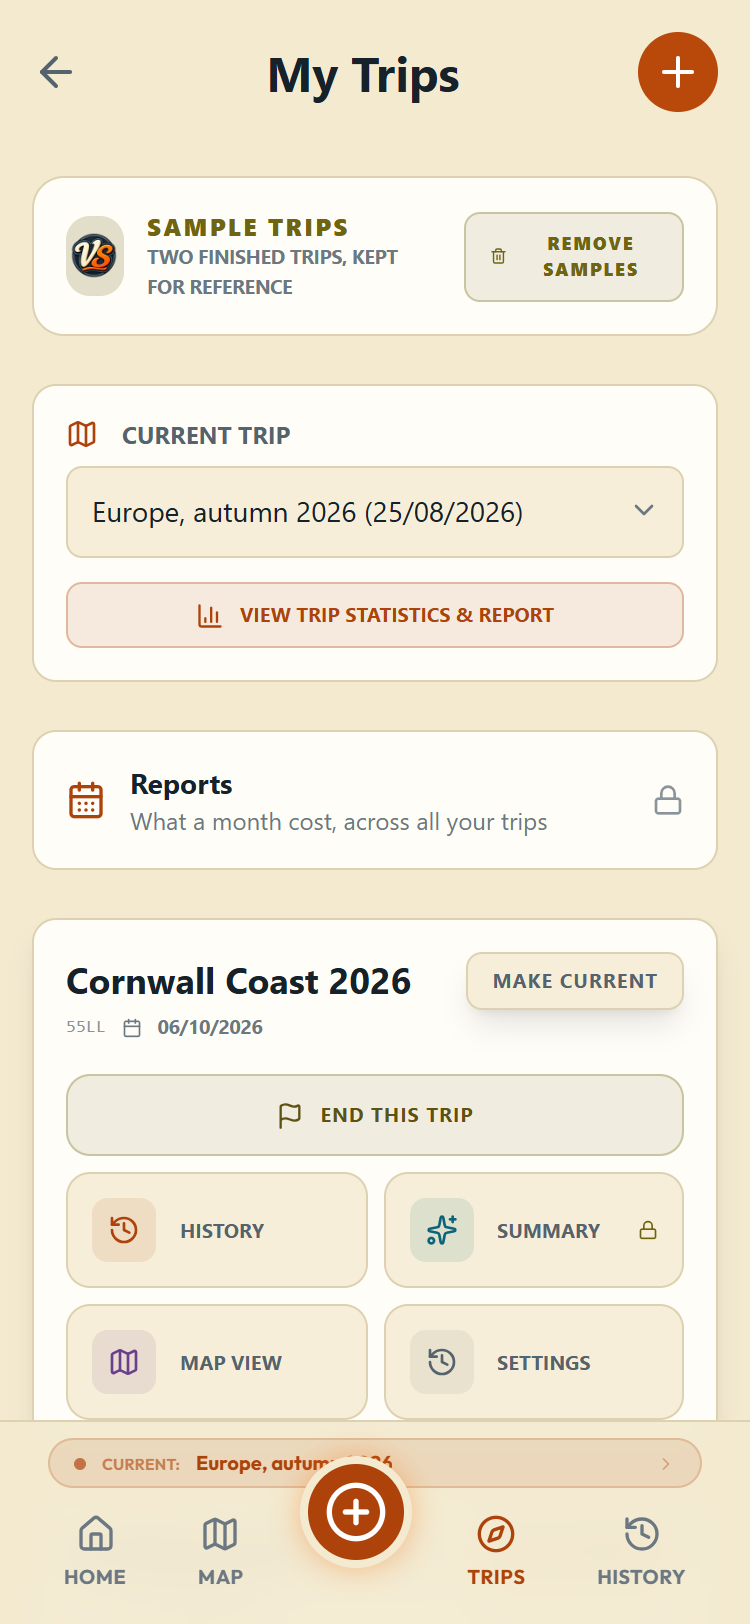
Each trip card gives you four buttons: History (that trip's entries), Summary (its report), Map View (its route), and Settings (everything about the trip).
Starting a trip
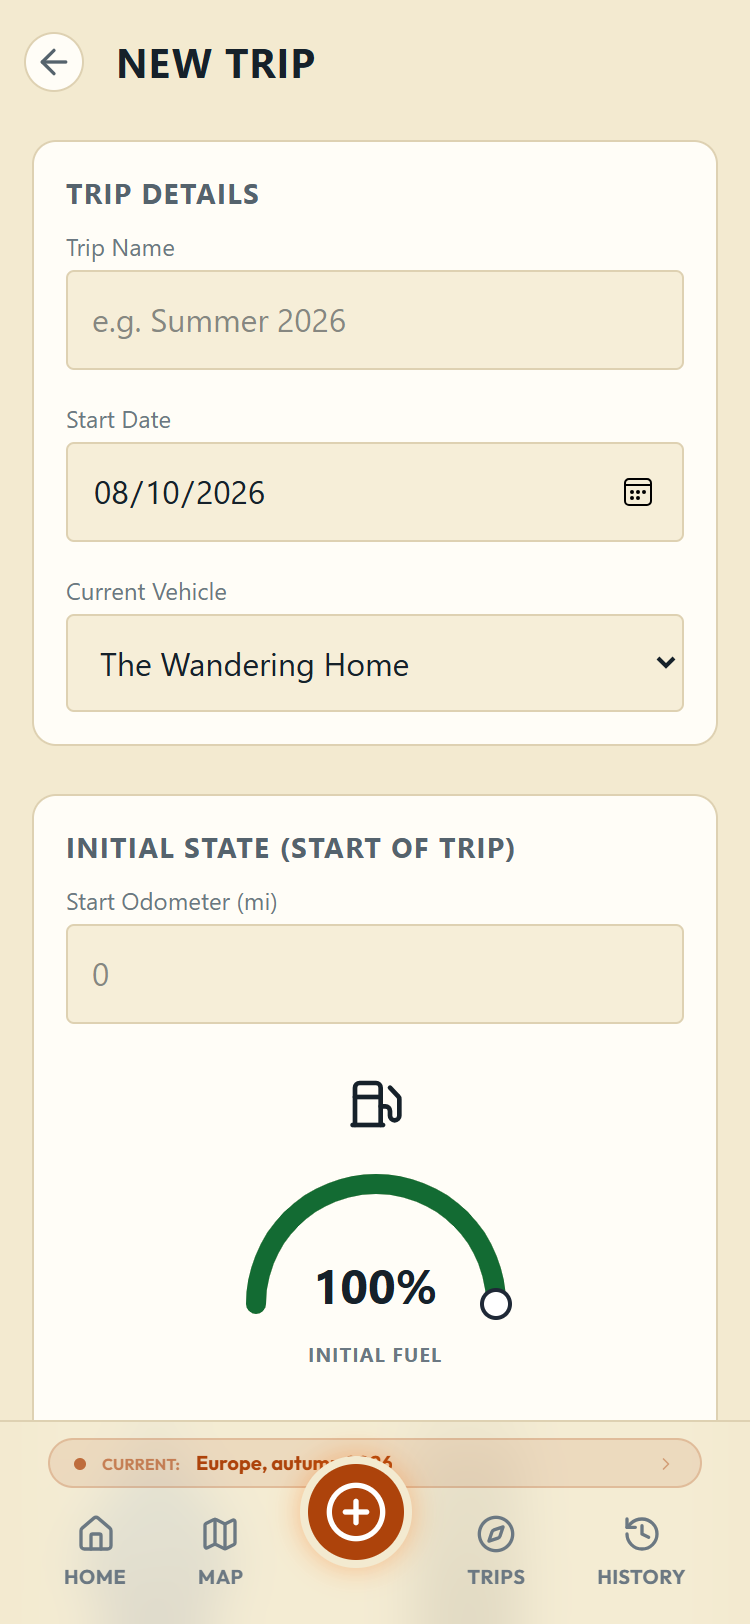
Tap the plus on My Trips
Pick the vehicle
Create Trip
Managing a trip
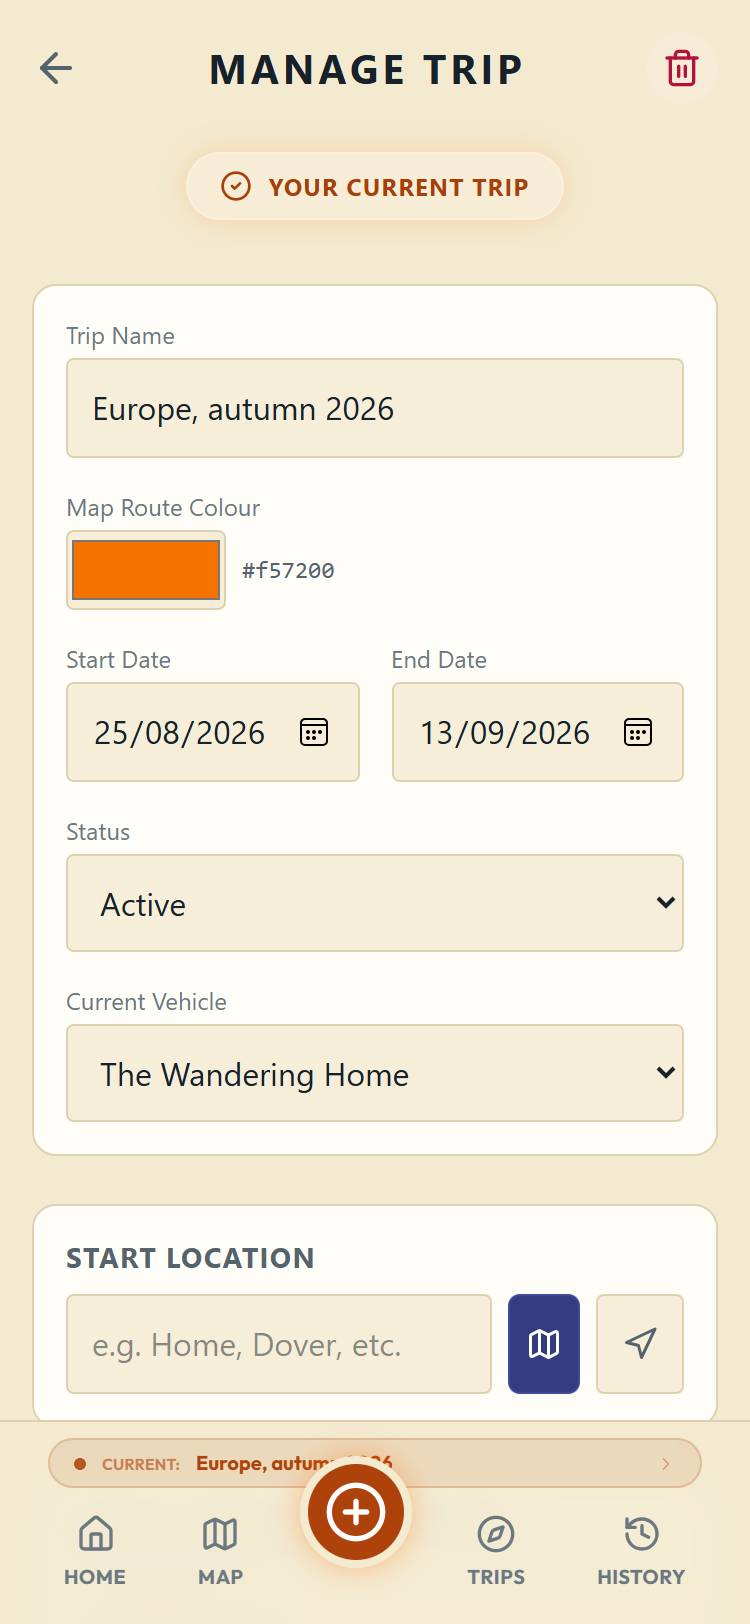
The Settings button on a trip card opens Manage Trip. You can rename the trip, change its dates and status, pick the colour its route is drawn with on the map, set a start location (type it, pick it on the map, or use your current position), and adjust the starting odometer and levels.
Ending a trip
Tap End Trip
Record the journey's end
Check the final levels

Ending a trip marks it completed and takes you straight to its summary. The trip stays in your list; nothing is deleted. Nor is ending it a one-way door: the Trip End card in History can be edited, or its ending deleted, which simply opens the trip again.
It also stops being your current trip, because a finished trip is the wrong place for tomorrow's entries. Only that trip is affected: if your current trip was a different one, that one stays put. The next thing you log asks which trip it belongs to, and the tick box in that question sets your new current trip.
Trip reports (Pro)
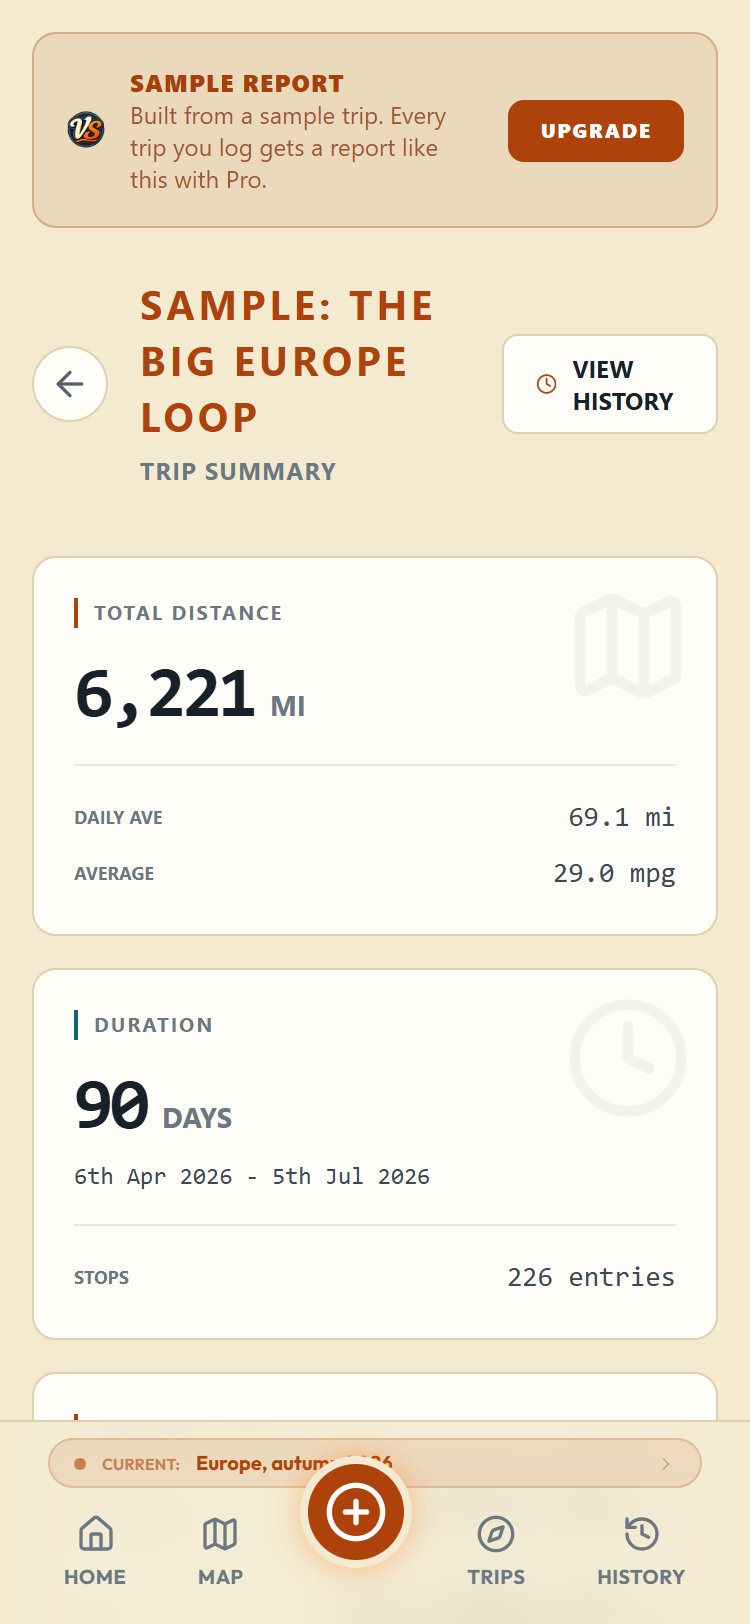
The Summary button builds a report for one trip. The headline numbers come first: total distance with a daily average and your fuel economy, duration as a number of days with the dates the trip ran and how many entries it holds, and spend by currency. A map of the route sits under those, then an Itemised Spend card that splits that spend entry by entry (pitches, fuel, ferries, tolls and the rest), fuel and fluid totals, and charts.
The Route card draws every entry that has a location, in the order you logged them, joined by a line in the trip's own colour, with white dots at the start and the end. Tap a dot for the place name. It is a picture rather than a map you can move: pinching and dragging do nothing, and Open full map in the corner takes you to the Map screen showing just that trip, where you can.
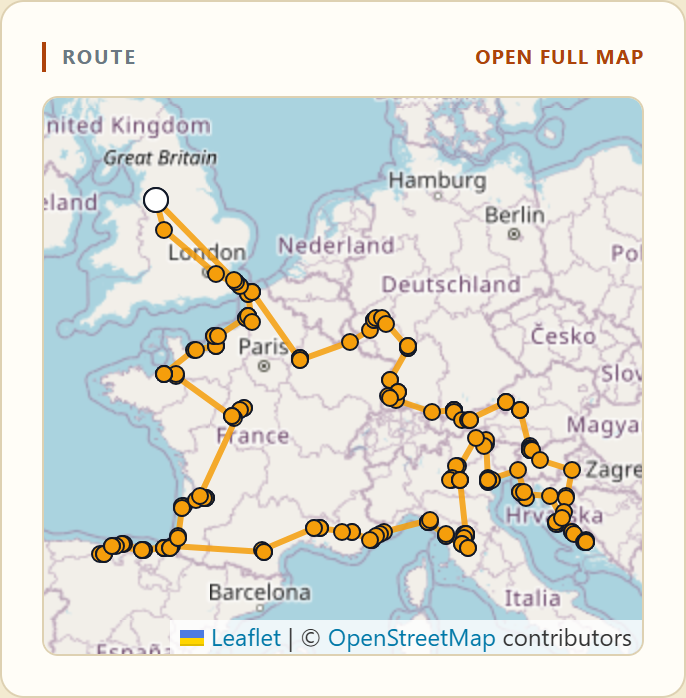
Reports are a Pro feature. On the free plan the Summary button shows a padlock, and the summary page offers a sample report built from one of the sample trips, so you can see exactly what you would get before deciding.
Itemised Spend is where the money stops being a total and starts being a list. There is a section per kind of cost, closed to begin with so the card stays short; tap one and it opens to show every entry behind the number, with its date, where you were, the first line of your notes and the amount, then a subtotal and a per-day figure at the bottom.
Everything is in there, not just the shopping: fuel, gas, tolls, ferries and the costs you logged at a night stop sit alongside groceries, meals, attractions, van parts and the rest. The per-day figure is the one worth looking at if you live in the van, because "what does food cost me a day" is a question a total never answers. The three-letter currency code only appears if the trip crossed into a second currency; on a trip that stayed in one, the figures read plainly.
Trip Analysis is the line chart lower down, with a row of pills under it for the things it can draw. It opens showing your odometer alone, and the scale on the left is the odometer reading. Switch on a level, like fresh water or fuel, and the left-hand scale becomes the nought-to-a-hundred one those need.
The line starts and finishes with the trip itself. What you recorded when you started it is the first point and what you recorded when you ended it is the last, labelled Trip start and Trip end when you touch them. So the tank and battery readings you took on the way home are part of the picture rather than something the chart forgets after your final stop.
If you are hunting for Service Breakdown, the card that used to sit further down, it has gone. It split the same spend by what you were paying for, and Itemised Spend higher up the page does that and then opens each line to the entries behind the number.
Reports: a month, or any dates you choose (Pro)
A trip summary answers "what did that trip cost". Reports answers "what did that month cost", which is the more useful question if you live in the van full time and never really start or finish a trip. It adds up every entry in the period across all your trips, not just one.
Reports opens on a list. Month or date range is the first one, and the steps below are about it. Wild against paid shows what your nights cost by stop type, per night, and what the nights that cost nothing saved you. Fuel lists every fill with its price per litre, gallon or kWh, the cheapest and dearest, and the average economy for each vehicle. Tanks and batteries works out how fast your water, toilet, gas and batteries go, from the arrival and departure levels on your overnight stops. Best nights ranks your overnight stops on quiet, views and signal. Compare puts two trips or two years side by side. By currency adds up what each currency cost you a day and a night. The year shows spend, nights and distance month by month. All of them leave the sample trips out.
Open Reports from My Trips
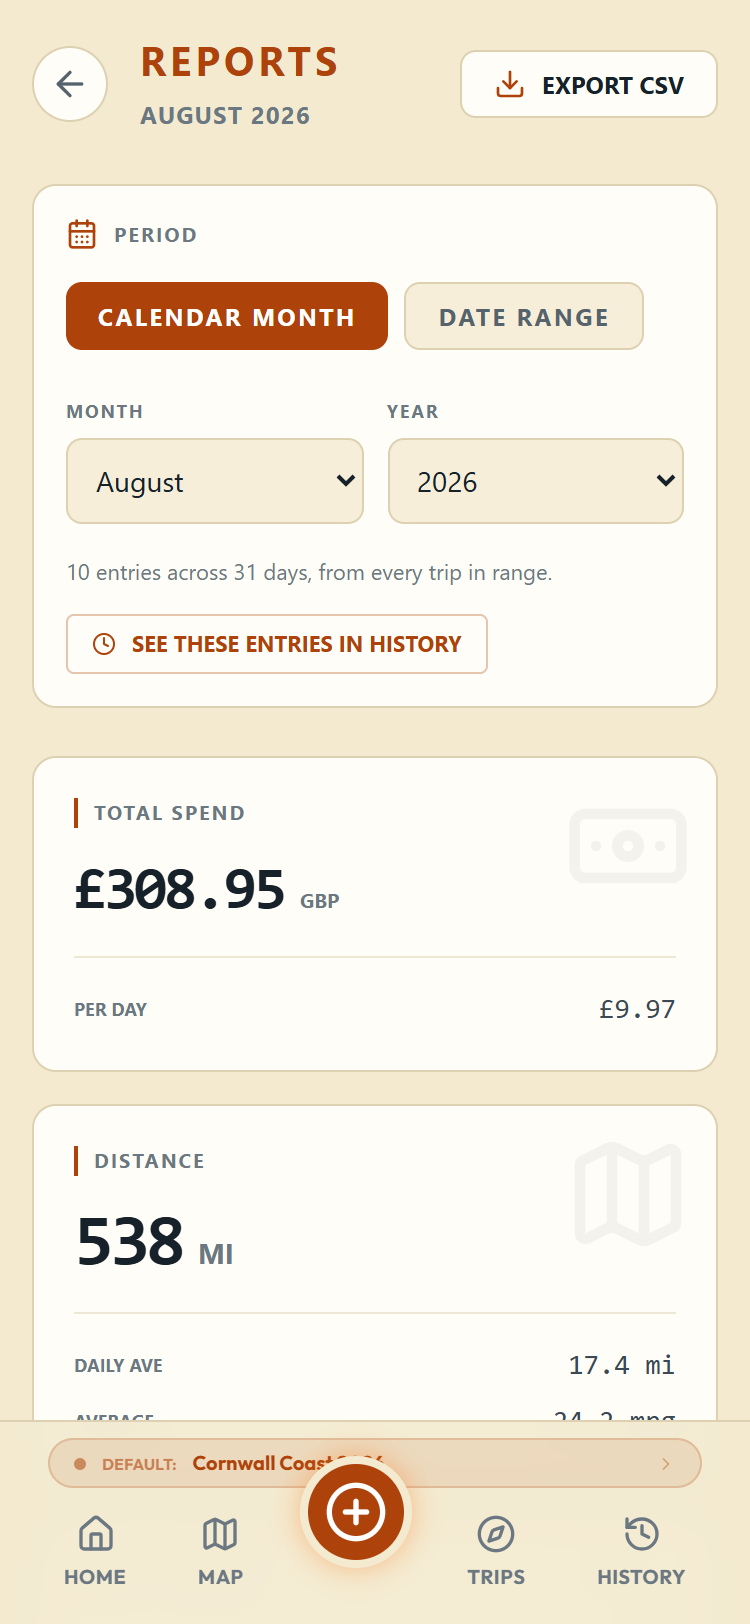
Choose a calendar month
Or set your own dates
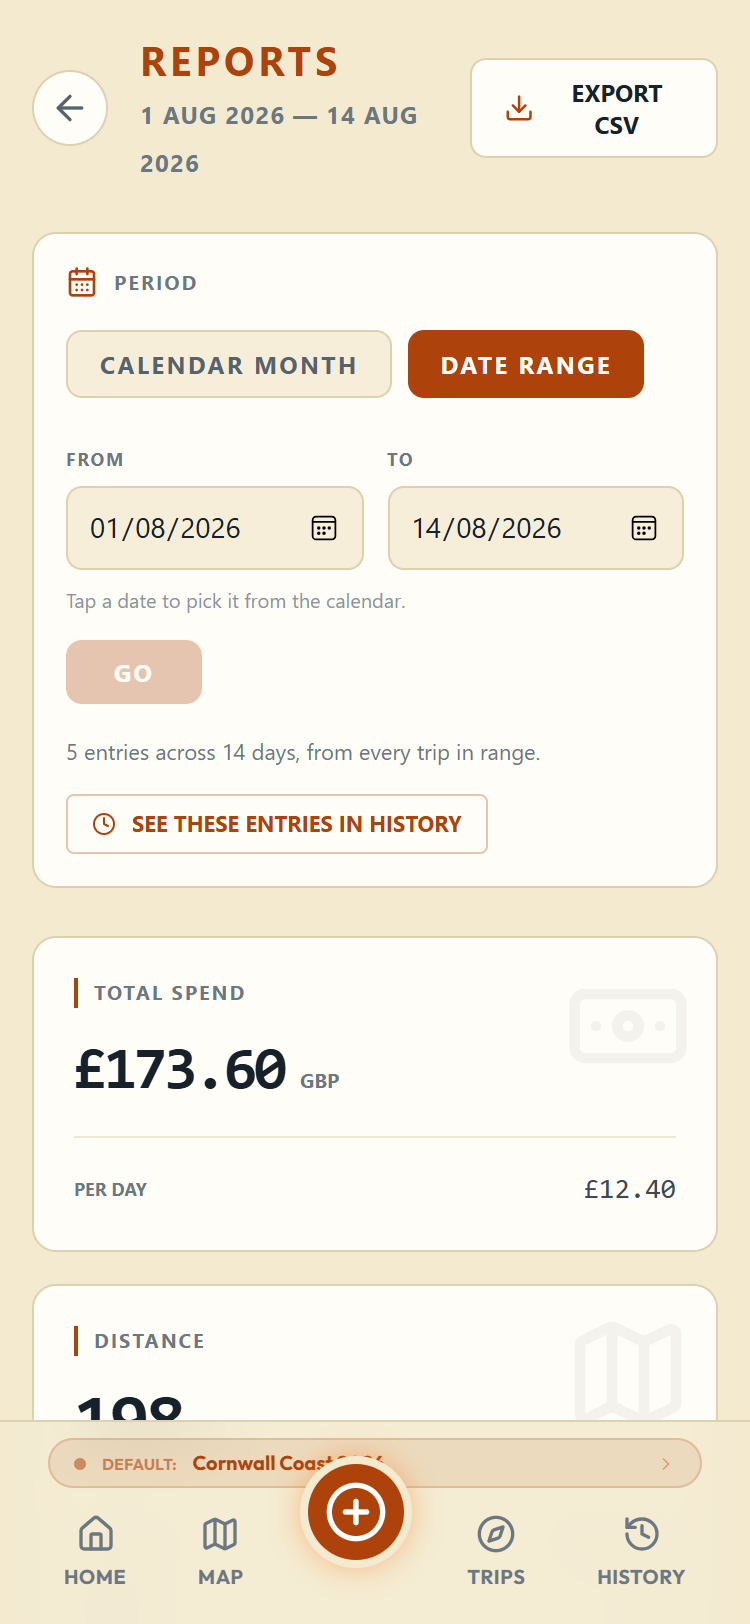
Press Go
What the figures mean
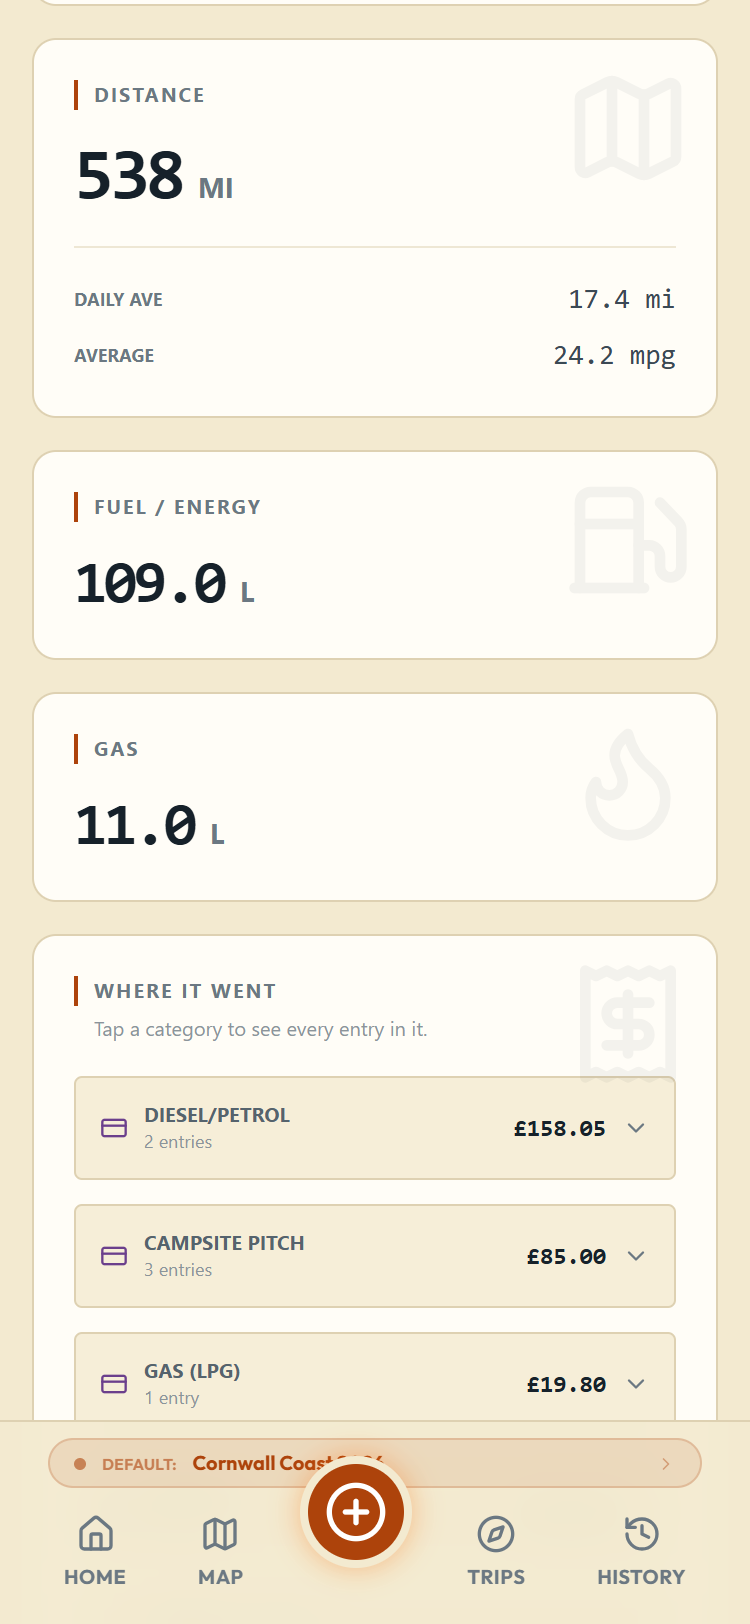
Under the period picker a line tells you how many entries the report is built from and how many days it covers. Then four cards:
Total Spend is everything logged in the period, with one line per currency. Nothing is ever converted between currencies, so euros and pounds stay on separate lines. Underneath, Per Day divides each of those totals by the days in the period you chose, not by the gap between your first and last entry. A month report divides by the days in that month even if you only logged in the first week, which is what you want if you are working out what living costs you.
Distance is how far you covered, from your odometer readings, with a Daily Ave and an Average below it. The Average is your fuel economy, worked out from one full tank to the next rather than from every splash of fuel, which is the only way to get an honest figure. If it cannot work one out it says N/A, and holding it tells you why. If the period covers more than one vehicle, each vehicle's own odometer span is worked out separately, converted into the distance unit you set in Global Settings, and then added up. So a van that reads in miles and a second vehicle that reads in kilometres still give you one honest total in your own unit.
Fuel / Energy and Gas are the volumes you put in over the period, shown in your chosen unit.
Where It Went itemises the spending, biggest first: pitches, hookup, laundry, showers, water, waste, rubbish, parking, tolls, ferries, groceries, eating out, van parts and repairs, and the rest. Money you entered in a stop's refuel details is in there too: fuel appears on the Diesel/Petrol line and gas on the Gas (LPG) line, alongside anything you logged as a fuel or gas cost. It is the same card as Itemised Spend on a trip summary, keeping its old name here: sections you tap open, each listing the entries behind the number with a subtotal and a per-day figure. Below it are the same charts you get on a trip summary, drawn for the period instead of the trip.
The Daily Costs bars cover every day of the trip, or of the period you chose, whether or not you spent anything that day. If you were in two currencies there is one chart each, and because they share the same run of days they sit one above the other and can be read together. A day you spent nothing in is an empty slot rather than a missing one, which is the point: a single purchase shows as a single bar on a proper calendar instead of filling the chart.
Under the bars is a row of pills, one per category, each in the colour it draws in: Fuel (Charging on an electric van), LPG, Fees, Services, Food, Days Out, Van Parts and Other. Tap one to hide that category and tap it again to bring it back, in any combination, so you can see what food alone cost without fuel towering over it. LPG only appears if there was gas on the trip. Each chart keeps its own set, so hiding Fees on the euro chart leaves the pound chart showing them. On a trip summary every chart remembers its own choice for that trip, on the device you set it on, the same way the Trip Analysis pills do. In Reports the choice lasts while you are on the page and starts fresh when you come back.
Empty months, sample data, and the Pro padlock
If nothing was logged in the period you picked, the report says "Nothing logged in" that month and invites you to pick another one or widen the dates. If you still have the sample trips it also reminds you that their entries are not counted. That is what a brand new account sees, and it is normal: the figures appear as soon as you have entries in range.
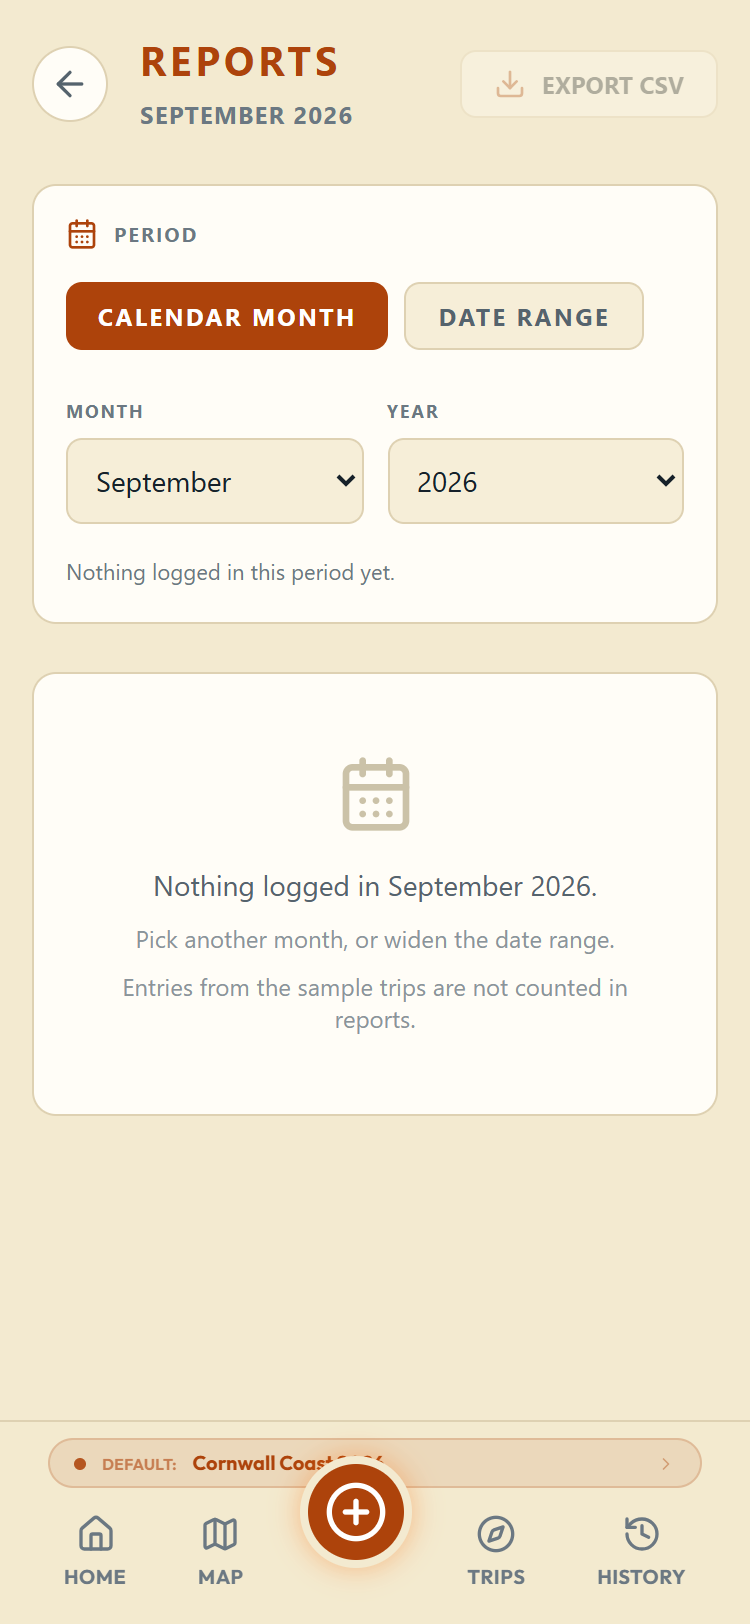
The sample trips that come with a new account are deliberately left out of every report, so sample figures can never inflate a real month.
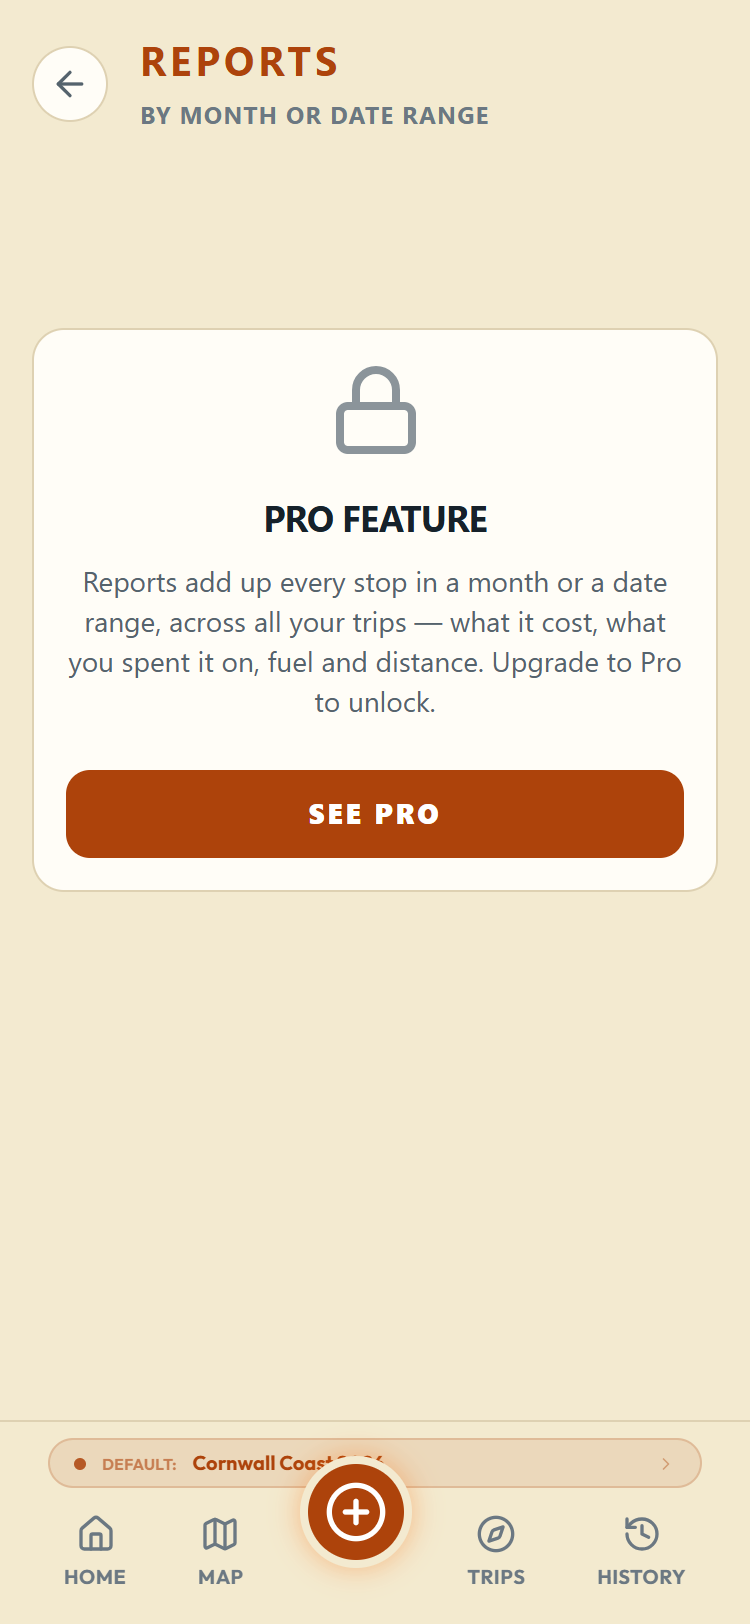
Reports is a Pro feature, the same as trip summaries. On the free plan the Reports row carries a padlock, and opening it explains what the screen does and offers the upgrade.
Your vehicles
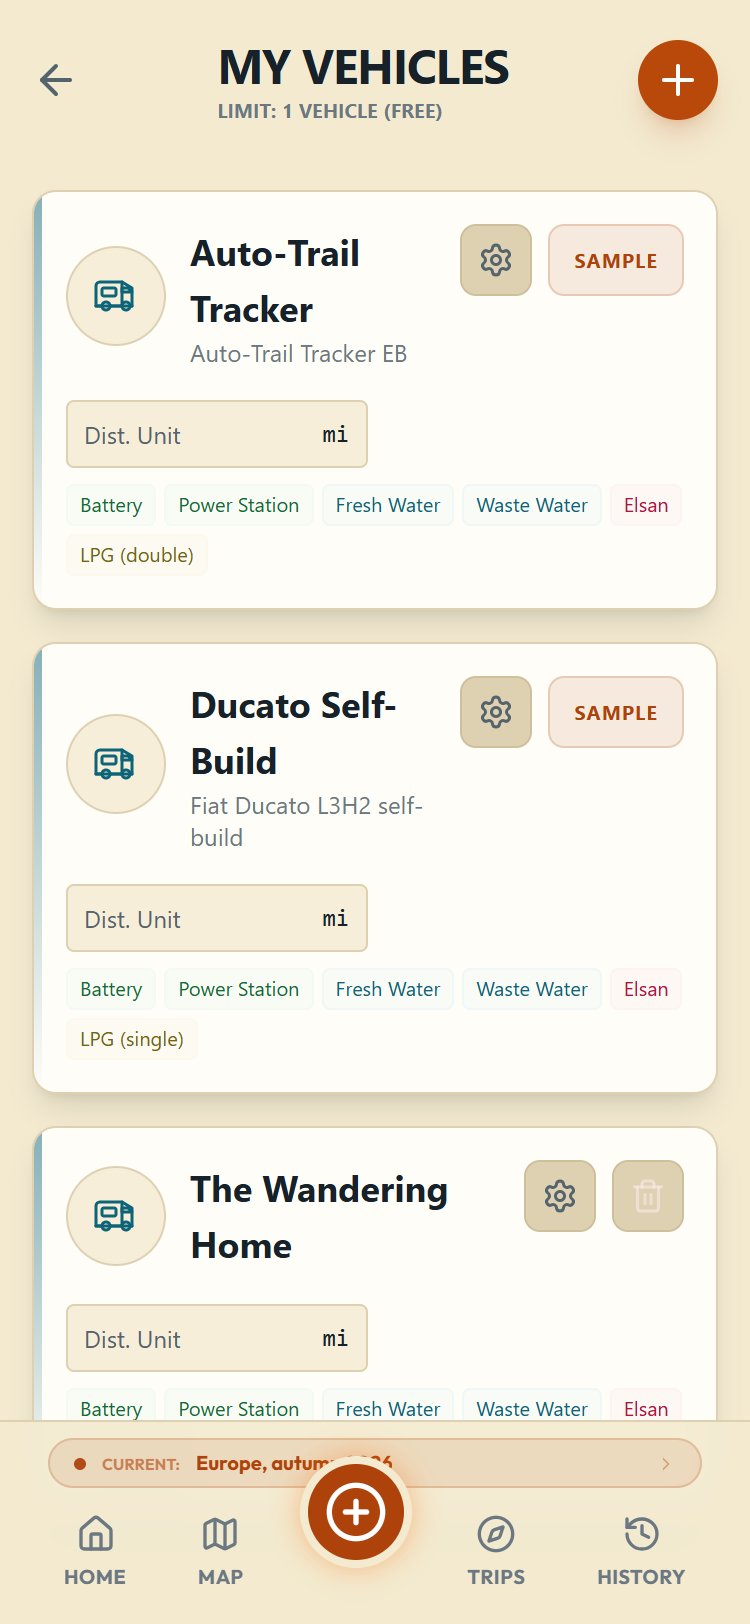
Vehicles live under Settings > My Vehicles (and the setup wizard creates your first one). A vehicle records its name, make and model, fuel type (diesel, petrol or electric), distance unit, and which systems it has: leisure battery, power station, fresh water, waste water, toilet, LPG (single or double bottle). Those toggles decide what you see when logging, so keep them honest.
Switching on a leisure battery or a power station adds one more question, How is the level shown?, answered separately for each: Percentage (%) or Voltage (V). That sets what you are asked for when you log, and changing it later does not alter readings you have already saved. The Logging guide covers what the two mean and when a voltage reading is worth trusting.